Uber is fast rising as the preferred transportation medium for many due to its convenience. This popularity has translated to a significant market share for the brand globally. Before the advent of Uber, many people had to wait for an hour or more to get a cab to a venue. A cab arriving at the nick of time was indeed a nightmare in a place like California. This was frustrating as it caused many to miss appointments due to lateness.
Uber’s introduction was a breath of fresh air in many places, and it has become a go-to for many. In 2022 alone, Uber recorded up to 64 million trips, amassing approximately $31.8 billion in revenue. This number is expected to keep skyrocketing as long as people patronize Uber in the coming years. If you’ve ever taken an Uber ride or plan to do so, you might be interested in learning more about the company. Read on as we explore recent Uber statistics regarding its growth, revenue, and possible future trajectory.
Key Statistics
General Uber Statistics

1. Uber Operates Across 72 Countries of the World.
Uber, launched in 2009, was initially called UberCab. It has since established a presence in 72 counties and is at the forefront of rideshare apps today. It is a force to reckon with in the transport industry. This has not been without some challenges or setbacks in some countries, as lawsuits have been filed against them in certain countries. Over 170 lawsuits have been filed against the most prominent private transport startup in the United States.
2. Uber’s Gross Bookings in the Fourth Quarter of 2023 Rose By 22% to $37.6 Billion.
Total bookings in the last quarter of 2023 increased by 22%, ending at $37.6 billion. In terms of mobility booking, Uber made $19.3 billion and had delivery bookings of $170 billion, meaning an average of about 28 million trips were made in a day.
3. It Had 6.8 Million Monthly Active Drivers Close to 2023.
The number of Uber drivers worldwide increases every year. At the end of 2023, the monthly number of drivers actively involved in Uber services was 6.8 million.
4. The Company Had 28 Million Trips During the Fourth Quarter of 2023.
The number of daily trips keeps rising as more people engage the services of couriers and drivers on Uber. Up to 28 million daily trips were made during the last quarter of 2023.
5. Uber Made More Than 7.6 Billion Trips In Just 2023.
Uber carried out 7.6 billion visits from 72 countries in 2023.
6. Cities Like New York and Chicago Account for 22% of Uber Bookings.
Five major cities, New York, Los Angeles, London, Chicago, and Sao Paolo, produce 22% of all Uber bookings. This means that $5.58 billion of Uber’s gross rideshare comes from these cities.
Uber Ride Statistics

7. Every Quarter, Uber Records Not Less Than 1.44 Billion Trips.
For some years now, Uber has completed 1.44 billion trips globally. The record slowed down by 24.21% during the pandemic. However, this picked up towards the end of 2020. The story has since changed, with over 7.6 billion completed trips at the close of 2022.
8. There Was a Fall of 9.7% in the Number of Active Monthly App Users In 2020.
Like several other companies, Uber felt the sharp effect of the COVID-19 pandemic in 2020. This caused the number of active monthly Uber users to fall to 93 million, meaning a 9.7% decline in App users worldwide.
9. Uber Alone Controls Up To 74% of the Ridesharing Market In the United States.
Statistics show that Uber controls a large portion of the ridesharing market in the United States and has, over the years, maintained between 68% and 74% control over the industry. In 2023, Lyft, another ridesharing service, was able to grasp 26% of the industry.
10. As Many as 63% of United States Ridesharing Customers Use Uber Alone.
A large percentage (63%) of ridesharing folks in the United States use Uber only. Lyft, on the other hand, has 27% of loyal customers. Another 10% of ridesharing customers use Uber and Lyft from time to time. Those using both platforms spend a yearly average of $247, more than the average faithful Lyft customer ($169).
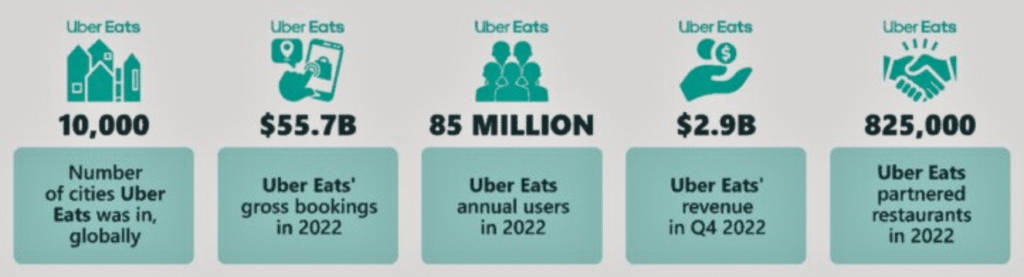
11. Uber Has a Presence In More Than 10,000 Cities Across the Globe.
Uber has expanded from San Francisco to over 10,000 cities worldwide, a feat that has been achieved despite its many twists and turns.
Revenue and Market Share
12. Gross Bookings Fell to $14.7 Billion in the Third Quarter of 2020.
Uber bookings fell by 10% in the third quarter of 2020. The company ended the quarter with just $14.7 billion in bookings.
13. Revenue in 2020 Dropped By 18% Within One Year in a Row.
Uber’s revenue fell 18% in 2020, causing mobility revenue to drop 53% from the previous year. However, Uber did pretty well regarding delivery revenue, recording a 125% growth between 2019 and 2020.
14. It Had Quite a Loss of $1.1 Billion, Which Included Stock Expenses.
In 2020, the company’s net loss was $1.1 billion, including a $183 million stock expense.
15. Uber Had the Most Significant Portion of the Ridesharing Market in 2015, With 91%.
2015 is Uber’s glory day, with the largest market share at 91%. However, its market share has fallen, though it still holds the industry’s majority share. It fell to 71% in 2018 and dropped further to 68% at the close of 2021.
16. Total Bookings in the Fourth Quarter of 2022 Increased By 19%.
There was a 19% rise in gross bookings in the last quarter of 2022. This brought the sum to $30.7 billion during the period under review. Uber was able to make a gross mobility booking of $14.9 billion. This was a 31% increase from what it had in the previous year. Up to 19% more trips were made in that same quarter. This implies that about 23 million visits are made every single day.
Fascinating Uber Statistics
17. Mobility Bookings Across All Countries Dropped By 46.46%.
Only $58 billion in bookings were made across all Uber Cities in 2020, implying a 46.46% fall in global bookings.
18. Uber Employees Earn An Average of $150,000 Every Single Year.
The average employee receives an annual paycheck of $150,000.
19. Uber Eats Raised About 11 Billion In Revenue At the End of 2022.
Globally, Uber Eats generated almost 11 billion in revenue in 2022. This meant a 31% increase from what it had the past year. It made up to $8.3 billion in revenue at the end of 2021.
20. Uber Had 3.5 Million Drivers on Its Platform In 2020.
According to statistics, the number of Uber drivers stood at 3.5 million in 2020, a significant slash from the previous year, 2019, when it had a record high of 5 million. This driver reduction during the pandemic is due to the limited movement in many places.
21. Its Gross Bookings Were as High as $150 Billion At the Close of the Fourth Quarter of 2023.
As 2023 rounded up, the number of bookings made on the platform increased. During the last part of the year, it had $150 billion in bookings.
22. As Many as 150 Million Folks Used the Uber App At the End of 2023.
Uber app was used not less than once a month by 130 million folks at the beginning of 2023. This was a 7.7% increase from what it had in the past year. The year ended with 150 million monthly customers from across the globe. This was a 15% increase from what it had in 2022.
Must-Know Uber Statistics

23. UP to 95 Million Uber App Downloads Were Made From Various Parts of the World In 2020.
Uber, which started as a means to solve transport problems in San Francisco, has grown to great heights. In 2020, it had 95 million app downloads worldwide, a massive feat of success, as Lyft had just 25 million app installments in that same period.
24. The Company Has 22,800 Workers, of Which 54.37% Are Outside the United States.
Of the 22,800 employees receiving paychecks from Uber, those working outside the US account for about 54.37% of the workforce. This shows that the more significant percentage is in the United States.
25. There Were 111 Million Uber Active Customers In 2019.
According to statistics, the number of active monthly Uber customers increased by 22% in 2019. Trips within the period were 1,907 million, 28% more than in the past year. Total bookings at the end of the last quarter of the year stood at $18.1 billion. This showed that Uber had a 28% increase in growth within a one-year timeline.
26. It Made Almost $32 Billion In Revenue At the End of 2022.
Uber has made quite a name for itself in ridesharing service. It is the most used service provider in all parts of the United States. At the close 2022, its global revenue rose to about $32 billion.
Conclusion
Uber is a game changer in the ridesharing industry. An idea born by two men is now a global household name. Over the years, Uber has grown to cover several frontiers, such as Uber Eats, Uber Ride, and Uber Freight. Wondering why Uber is a leader in the ridesharing industry? It is not far-fetched as its services are readily available with just a click on the Uber App.
Drivers can now earn a more decent income with Uber. How about food delivery? This came in very useful during the Covid-19 pandemic. People could bring their favorite dishes to them. Uber has turned out to be one with the golden touch. It has taken the transport and food delivery sectors to a new level. These statistics testify to Uber’s growing relevance, how it affects people’s daily lives, and where the ridesharing market is headed in the coming years.
FAQs
It made 28 million trips daily in the last quarter of 2023.
People living in Columbus are likely to spend $26 every single month on Uber. In some other places like Charlotte ($34), Michigan ($34), and those in Salt Lake City spend $26.
More people use the Uber app and other services year after year. Statistics show that the number of Uber customers reached 150 million at the end of 2023.
You earn an average of $150,000 annually as an Uber driver.
The United States and Canada contribute the most to Uber’s revenue. The Cities with the most bookings are Los Angeles, London, Chicago, New York, and Sao Paolo.