Founded by Jeff Bezos in his garage-rented home in Bellevue in 1995, Amazon has grown into the largest e-commerce and online retail store worldwide. With its innovative subscription model, Amazon has greatly retained its customers and generated revenue.
Known as one of the world’s best-selling platforms, Amazon boasts over 2.4 billion visits monthly as of December 2023. It boasts a unique visibility and sales that only a few online marketplaces can match. Learn how well Amazon has fared over the years through these captivating Amazon statistics, facts, and trends in 2026.
Key Amazon Statistics
General Amazon Statistics
1. Amazon vendors reported for third parties over 60% of the company’s total sales in the year 2023. Generated revenues by third-party sellers (3p sellers) have increased by 18% on Amazon compared to the previous years.
2. About 2 million small and midsize businesses worldwide are 3p (third-party) sellers on Amazon. 70% of these 3p sellers, as of the year 2023, operate as self-governing sellers by utilising the central operations.
3. The perfect launch used by Amazon vendors makes $100,000 at 5.2 times in the first sales of the year. That is, the average perfect launch generated by Amazon sellers is 6.3 times more in the first year than that of other sellers.
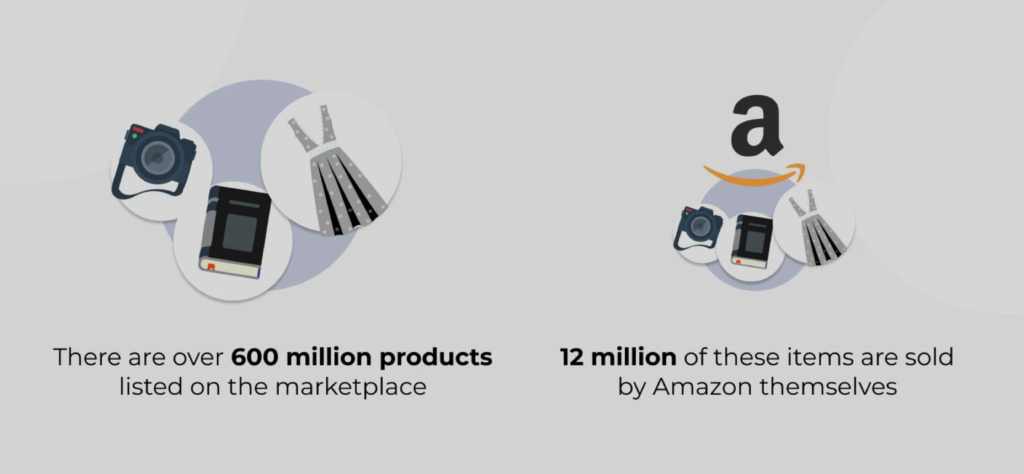
4. Over 600million products are being sold on Amazon. About 7,800 items are sold on Amazon every minute, giving sellers an average of over $230,000 in sales.
5. 82% of Amazon vendors and brands as of 2023 use Fulfilment by Amazon (FBA) for delivering their products. As of 2023, 64% of measured Amazon vendors used the FBA (fulfilment by Amazon) as a special product delivery choice.
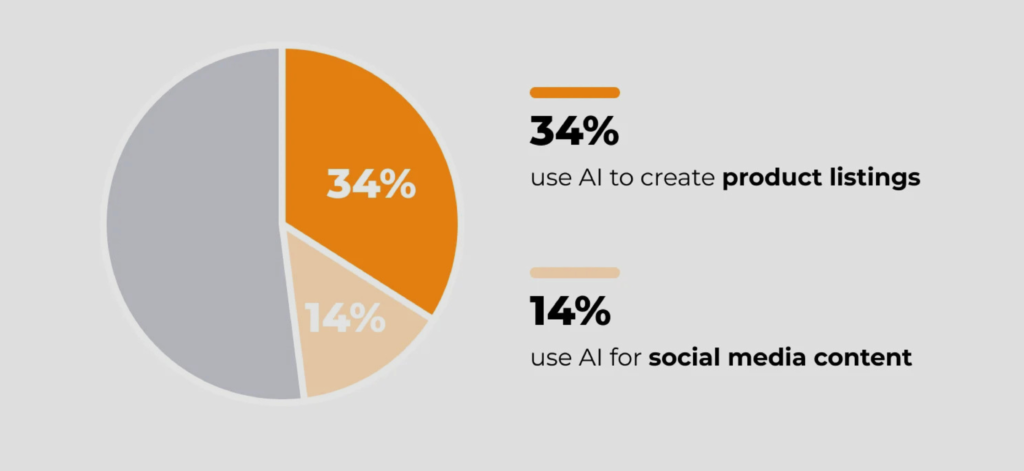
6. About 34% of Amazon vendors chose fulfilment by merchant (FBM) as their delivery method. About 14% of vendors specifically used FBM, with 22% going for a mix of FBA and FBM. That is, some used just FBM, while some used both FBM and FBA.
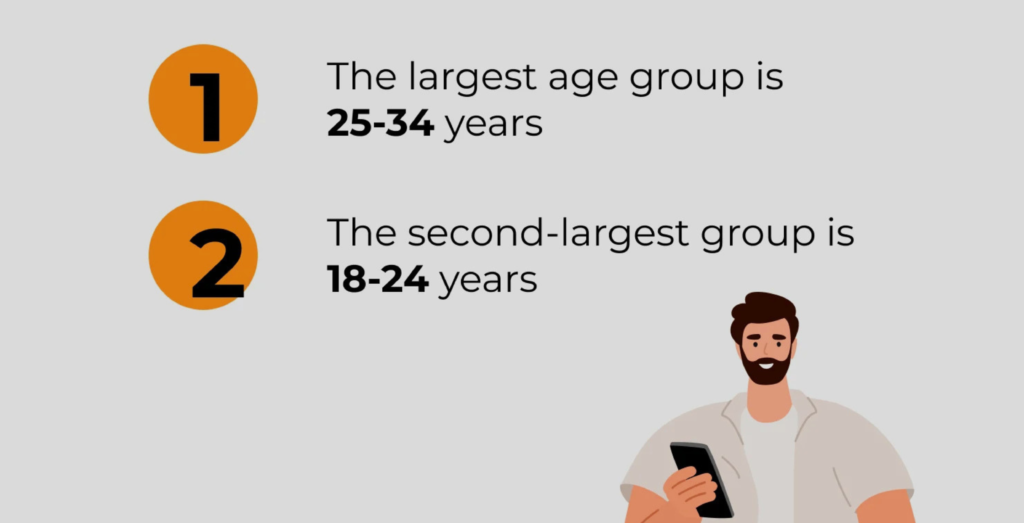
7. 30% of Amazon vendors were between the ages of 35 and 44 as of 2023. As of 2023, the age bracket of 28% of Amazon vendors was 25-34 years, with an extra 4% aged 65-80. The demography of 72% of genders was male, while 26% were female.
8. 39% of telecommuters, remote workers, and travellers considered themselves Amazon vendors as of 2023. About 55% of the vendors were based in the US, with 7% living in the UK and 6% in Canada.
9. 54% of the Private model was the ideal sales model for Amazon sellers in 2023. In Amazon, 25% were involved in wholesale, another 25% were involved in retailing, 21% were involved in online trading, 19% were drop-shipping, and 9% were homemade items.
10. 71% of Amazon vendors as of 2023 in the US source their products from China, while 3% stopped in 2021. 33% of vendors from the US source their products from China, which is a 7% increase from the previous years.
11. As of 2023, it was measured that 58% of Amazon vendors started their businesses with $5,000. 25% of Amazon vendors started businesses with $1,000, while 77% funded part of their Amazon businesses with their savings.
Amazon’s selling statistics in 2026
Amazon sellers, or the 3p sellers, are people who sell other brands and products. Amazon’s selling statistics are categorised into three demographics: location, gender, and education.
12. Location: 47% of Amazon sellers live in the US, while 9% live in Canada, the other 6% live in the UK, and 4% live in India.
13. Gender: Over the years, there has been a continuous trend of Amazon sellers being predominantly male.
14. Education: According to a study, 85% of most sellers on Amazon have just a secondary degree certificate.
15. The Amazon sellers make between $500 and $ 250,000 in profits monthly. That’s an average of $42,000.
16. With the growing number of experiences in Amazon, sales are growing every year. About 22% of small and medium businesses make about $10,000 every month.
17. As of 2022, 66% of 3p sellers make profit margins higher than 10%, and nearly 32% earn profit margins at 20%.
18. The first(1p) sellers provide records to Amazon and sales under their name and are branded under Amazon. However, (3p) sales became known in 2024 and now bring more sales on Amazon platforms. Only about 40% were third-party sellers on Amazon.
19. As of Q1 2024, Amazon’s third-party sellers contributed 61% of the marketplace‘s paid units.
Below is a table of third-party sellers on Amazon over the years.
| Year | Third-party seller % |
| 2023 | 60% |
| 2022 | 59% |
| 2021 | 56% |
| 2020 | 55% |
| 2019 | 53% |
| 2018 | 52% |
| 2017 | 51% |
20. There are about 2 million active sellers on Amazon. 9.7 million globally, and 2 million actively selling.
21. The United States has the top number of sellers as of 2024, which is about 1.1 million.
22. 50% of Amazon sellers were from California, New York, Florida, and Texas. The percentage of sellers based on states in the US is:
Amazon Revenue Statistics in 2026
Below are Amazon’s revenue history and growth rate from 2010 to 2024.
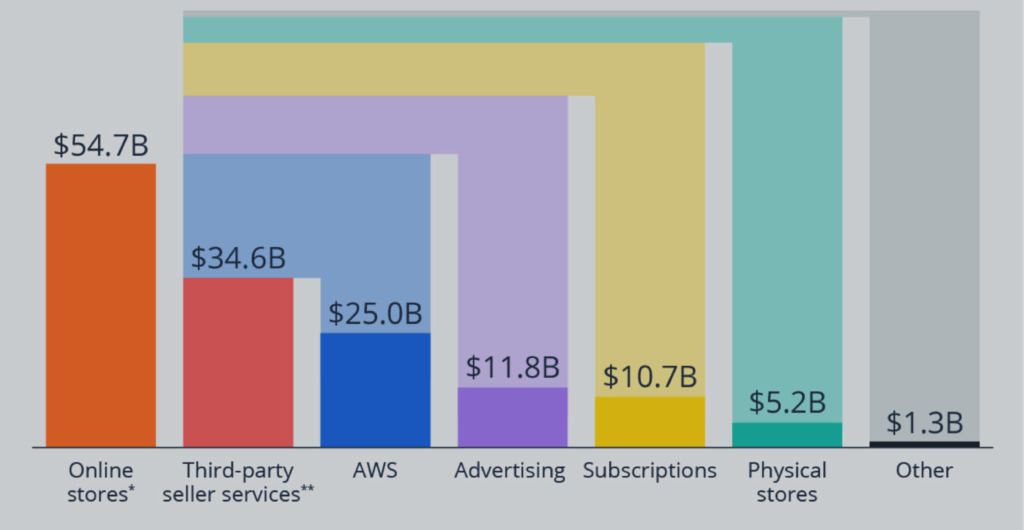
23. Amazon’s revenue as of March 31, 2024, was $143.313 billion, with an increase of 12.53% over the year.
24. The twelfth actual revenue for March ending 31,2024 was $590.740 billion, with an increase of 12.54% over the year.
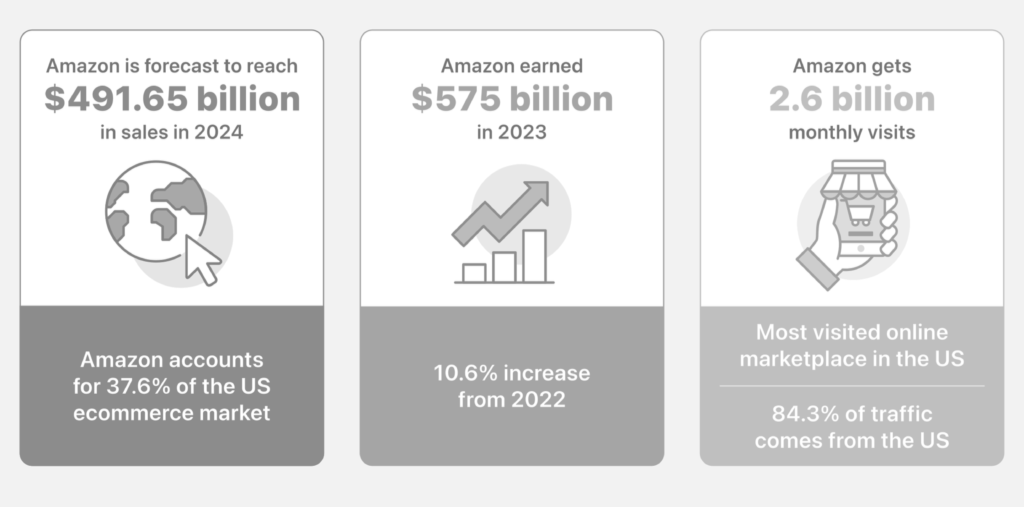
25. As of 2023, the revenue was $574.785 billion, with an increase of 11.83% from 2022.
26. In 2022, the annual revenue was $513.983 billion, with an increase of 9.4 from 2021.
27. In 2021, it was $469.822 billion, with an increase of 21.7% from 2020.
Captivating Amazon Employee Statistics
28. Over 1.5 million people are employed by Amazon.
29. Amazon had 17,000 employees as of 2007. This number increased by 62% to 1,298,000 as of 2020. As of 2023, Amazon had 1,525,000 employees, a slight decrease from the 1,608,000 recorded in 2021.
30. The 2022 annual report of Amazon employees is about 1,541,000, both full-time and part-time.
31. In the previous year (2007—2012), Amazon staff increased at the rate of 71,400, and by 2012-2017 it multiplied to 477,600.
32. From 2017 to 2022, the number of Amazon staff increased to 975,000.
33. The breakdown of Amazon workers mirrors a trend. From analysing the period from 2018 to 2024, just 4 out of 19 saw a drop in Amazon employees. Here are the top monthly changes in Amazon staff numbers:
34. 56.8% of Amazon’s labor force as of 2022 were male, and 43.1 % were female. This shows a change in Amazon’s labor force as of 2018, splitting from 58.1%male/to 48.9% females.
35. The US Amazon workers’ gender split is more stable. 53% of these workers were male, while 47% were female in the US as of 2021.
36. Based on ethnicity, 31.9% of Amazon workers were white, while black, was 26.1% and Latin was 23.4%.
37. In 2018, 34.4% were white, while 24.8% were black. 17.3% were Asian, 3.7% were multiracial, and 1.3% were native American.
38. As of 2019, 34.6% were white, 26.4% black, 18.6% were Latin, 15.4% Asian,3.6% multiracial, and 1.3% were native American.
39. In 2020, 32.1% were white, 26.5% were black, 22.8% were Latinx, Asian was 13.6%, multiracial was 3.6%, and Native American was 1.5%.
40. In 2021, 30.2% were white, 28.2% were black, 23.6% were Latinx, 13.2% were Asian, 3.3% were multiracial, and 1.5% were Native American.
41. In 2022, 31.9% were white, 26.1% were black, 23.5% were Latinx, 16.6% were Asian, 18% were multiracial, and 1.8% were Native American.
42. From 2018-2022, Amazon’s labor force changed. White became 6.5%, black 1.3%, Latinx 6.2%, Asian 2%, multiracial 1.9%, and Native American 0.5%.
Amazon Employee Role Statistics
43. The spread of Amazon workers’ roles differs based on ethnicity and gender.
44. About 76.9% of males hold the senior leadership role, while 66.4% are white senior leaders. 51.7% of Amazon’s male employees are in customer/field support, and of this percentage, 5.5% are blacks, 27.2% are Latinx, and 26. 7% are white.
45. 51.7% of Amazon staff are in customer support, corporate staff 67.2%, people managers 69.2%, and senior managers 76.9%.
46. Of female Amazon staff, 48.3% are in customer support, 32.8% are in corporate support, 30.8% are people managers, and 23.1% are senior leaders.
47. 26.7% of Amazon staff who are white are in customer support, 44% are corporate workers, 53.1% are people managers, and 66.4% are senior leaders.
48. 32.7% of Black Amazon staff are in customer support, 8.5% are corporate workers, 12% are people managers, and 5.5% are senior leaders.
49. In Latinx, 27.2% are in customer support, 8.7% are corporate workers, 10.9% are people managers, and 4.5% are senior leaders.
50. Of all Asian Amazon staff, 8.2% are in customer support, 34.4% are corporate workers,19.9% are people managers, and 21.5% are senior leaders.
51. Of all multiracial Amazon staff, 3.3% are in customer support, 3.2% are corporate workers, 3.3% are people managers, and 1.8% are senior leaders.
52. 1.7% of Native American Amazon workers are in customer support, 0.6% are corporate workers, 0.7 are people managers, and 0.2 % are senior leaders.
Amazon Customer Statistics and Facts
Amazon has become a place to shop online, with millions of users worldwide. Due to its customer reviews and trustworthiness, millions of people go there to shop for them.
53. Amazon has over 310 million active customers worldwide.
54. About 80% of Amazon users are from the US. Of the 310 million active users worldwide, bout 230 million are from the United States.
55. Amazon had about 2.72 billion monthly visitors in 2023.
56. Regular Americans spend around $91.75 monthly on Amazon.
57. Based on research, about 3200 online shoppers show that 25% of Americans buy from Amazon once every week.
58. Tennessee’s regular spending in the US is $124.22 every month, which is the highest among all the states in the US. The least spending of an American user on Amazon is $91.75 every month, while West Virginia spends about $56.10 and is said to be the lowest on Amazon.
59. 51% of customers use Amazon for product research. Amazon has become a trusted source for customers due to people’s genuine reviews. They use Amazon more than any other site online.
60. The percentage of people searching for the products on various platforms is:
61. 80% of Amazon customers use Amazon due to its fast delivery service.
Customers trust shops and find Amazon helpful while purchasing because of its big catalog and affordable prices. A study shows that most customers prefer to buy from Amazon due to Amazon’s fast and free delivery service. About 69% of Amazon shoppers were attracted by the wide collection of their products. The reasons why people use this product are as follows:
62. Amazon controls about 37.6% of online retailers’ market shares in the US. The second largest is Walmart, which controls 6.4% of the US online retail market.
Other Important Amazon statistics and facts
63. Amazon is one of the biggest companies in the world, and it has a large workforce.
64. Amazon recruited over 1.6 million workers in 2021, but this number has declined.
65. The number of their employees in 2023 increased to 1.50 million; in 2022, they employed 1.54 million more; in 2021, it was 1.60 million; in 2020, 1.29 million; and in 2019, 798,000.
66. They operate in 100 countries and control about 20 marketplaces.
67. 1.6 million worth of goods are shipped every day on Amazon.
68. They have over 600 offline stores.
69. The biggest consumer of Amazon is the United States, with about 395.64 billion US dollars as of 2023.
70. Germany ranks second with about 37.6 billion US dollars, and the UK ranks third with about 33.6 billion US dollars.
71. More than 60% of Amazon sales come from independent sellers.
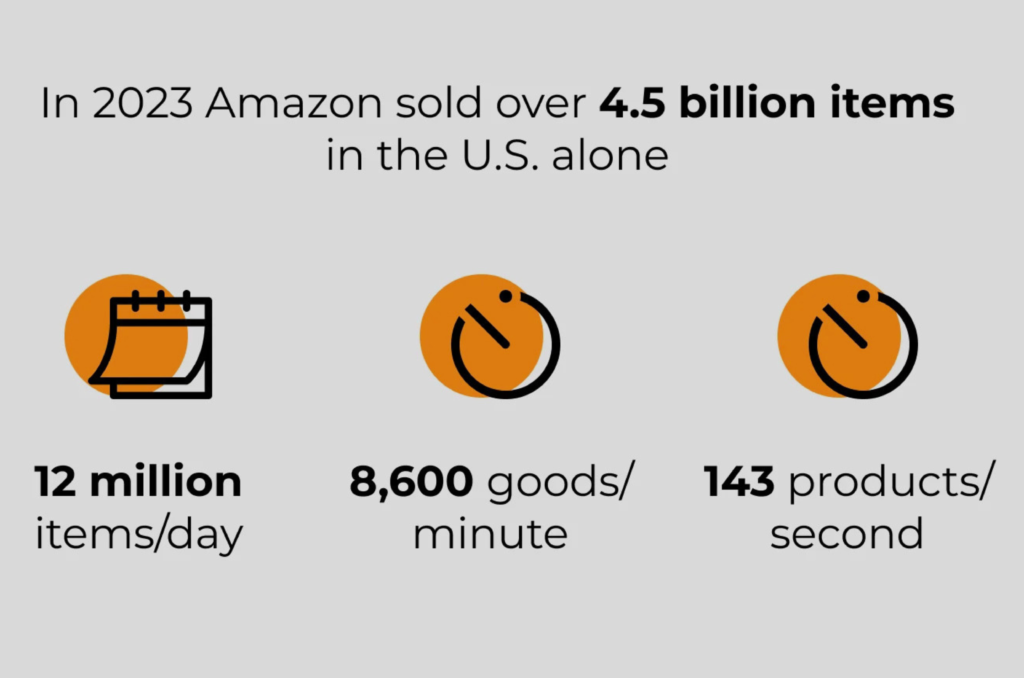
72. US-based sellers sold more than 4.5 billion items.
Conclusion
Amazon, as a huge online marketplace, should be put into view. The interesting thing about Amazon is that its drive doesn’t seem to be slowing down anytime soon. Amazon is on pace to exceed Walmart as the largest physical and digital US retailer in the years to come. While there are still great chances for third-party sellers (3p), the market’s progress is also growing in a race. The adoption rate of online shopping is growing in leaps and bounds, and Amazon will be at the forefront of this proliferation.
FAQS
The top consumers on Amazon are the United States, with about 395.64 billion dollars. And Germany, ranking over 37. Billion.
Amazon, with its trusted source for customers, has become 51% product research for its users due to people’s genuine reviews.
The amount of money a company receives from its customers in exchange for the sales of goods and services is revenue.
71% of Amazon vendors as of 2023 in the US source their products from China, while 3% stopped in 2021.
Amazon opened on July 1, 1995, and was founded by Bezos in his garage-rented home in Bellevue.
There are about 2 million active sellers on Amazon. 9.7 million globally, and 2 million actively selling. The United States has the top number of sellers as of 2024, which is about 1.1 million.50% of Amazon sellers were from California, New York, Florida, and Texas in the US.