Over the years, Facebook has remained resilient despite its several legal troubles, massive layoffs, and political disputes. The social networking platform has maintained its position as one of Silicon Valley’s most recognized companies.
The second quarter of 2022 was good for Facebook, as its shares soared by 16%. In Q2 of the following year, the platform realized a remarkable earnings of $32 billion, boosting the allure of the social media platform, especially for marketers.
As you may already know, Facebook is flooded with ads, encouraging the belief that it could generate enough revenue for marketers and creators alike. These facts and statistics on Facebook ad revenue give more insight into Facebook’s position as the social media platform with the highest ad revenue.
Key Points
General Facebook Statistics
1. As of April 2024, Facebook is the most popular social network globally, with 3.065 billion monthly active users. Trailing closely behind is YouTube, with 2.504 billion monthly active users. Instagram comes third with 2 billion monthly active users.
2. Cristiano Ronaldo has the most followed Facebook page, with over 122 million followers as of January 2023. Only Samsung and Facebook itself surpass Ronaldo in page subscribers. Facebook’s page has 214.62 million followers, while Samsung has 159.82 million.
3. Brand presence is a very serious business on social media. Social networks are among the highest traffic generators for retail websites in the US.
4. According to US internet users, Facebook is the digital channel with the strongest influence on purchasing decisions, outpacing even YouTube and Instagram.
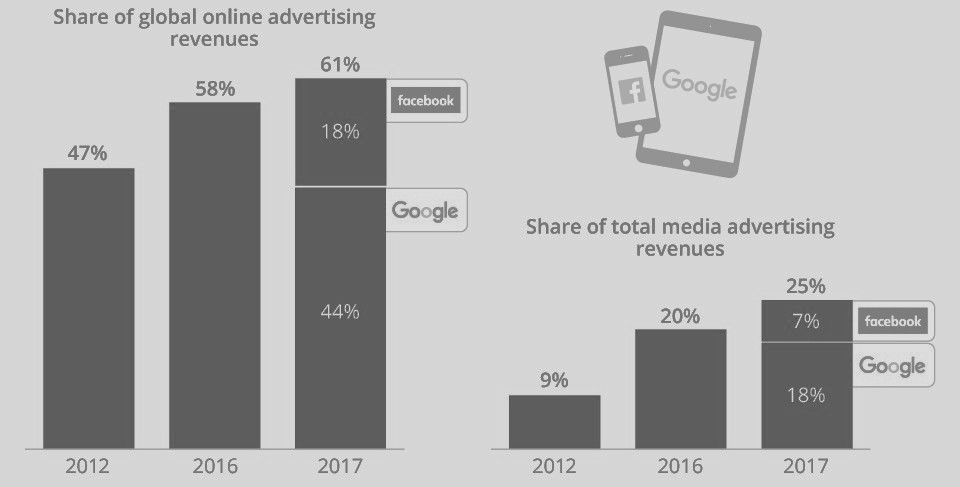
5. Facebook advertising transcends social media walls; the platform often ranks among US media firms with the highest ad revenue. Facebook is miles ahead of media behemoths like Fox, Disney, and Viacom in terms of ad revenue. Only Google surpasses Facebook in ad revenue.
6. According to a survey conducted in November 2023, about 82% of adults in the US said they are not willing to pay for Facebook or Instagram’s ad-free versions. Only 14% agreed that they would be willing to pay $10 monthly for ad-free versions. Gen X and Baby Boomers are the least likely to pay for ad-free versions of social media platforms
Statistics on Facebook Ad Revenue
The main driver for the millions of business accounts on Facebook is its wide audience range. This advantage makes running ads on social media platforms a profitable move, especially for businesses and marketers. These statistics present the potential benefits businesses can enjoy when they engage in Facebook ads.
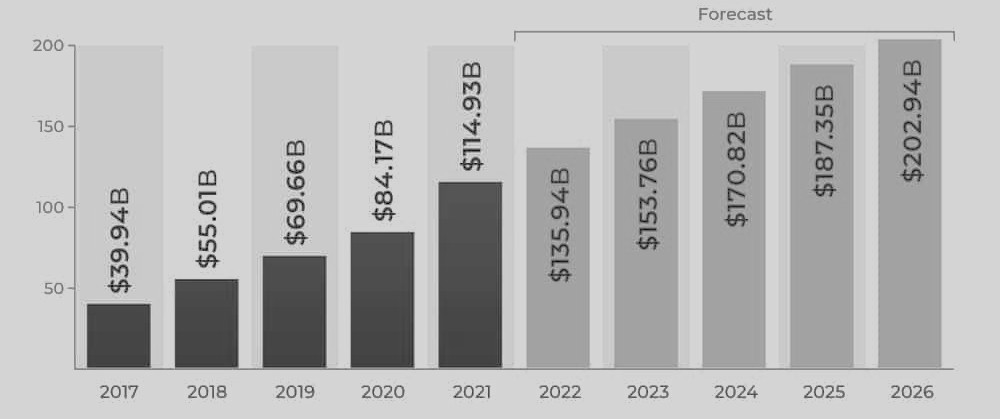
7. In 2022, Facebook realized $135.94 billion in ad revenue. At the end of last year, its revenue rose to the $153.76 billion mark. In 2023, the figures became stronger following the rebound of post-pandemic advertising activities. Facebook recorded an 11% increase in ad revenue as of the second quarter of 2023.
8. Facebook advertising revenue is estimated to exceed $127 billion by 2027.
9. Some experts forecast that Facebook ad revenue will grow by 9.7% to reach $187 billion by 2025.
10. Facebook generated $113.64 in ad revenue in 2022, accounting for over 97% of the platform’s total revenue. This was a slight decrease from the $114.93 recorded in 2021.
Facebook’s Popularity
11. Facebook is known in nearly all demographics as a functional means to advertise products and services. This contributed significantly to its user base in June 2023. At the time, the platform had more than 3 billion monthly active users.
Mobile-Friendly Ads
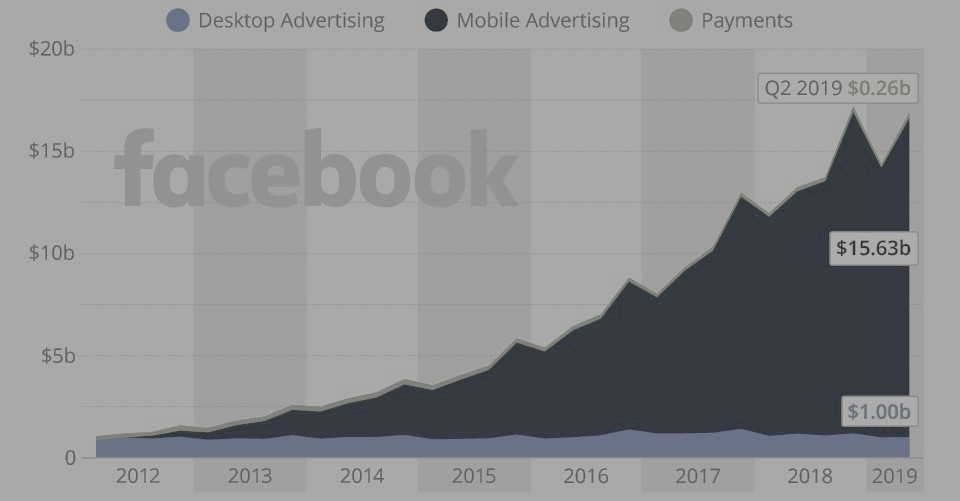
12. If your ads on Facebook are not mobile-friendly, they may fail to become profitable. This is because mobile devices hold 94% of the platform’s ad revenue. Interestingly, recent data reveal that 11.2% of the United States businesses’ marketing funds go for mobile marketing.
Increasing Advertisers
13. Originally, the creators of Facebook didn’t intend for it to be primarily an advertising platform. The initial idea was to build a social network for connecting people. However, as the user base grew significantly, it became clear that the data generated by these users held significant value. This realization paved the way for monetizing the platform through advertising. By 2023, Facebook had become a major advertising hub, boasting 10 million active advertisers.
Number of Uploaded Content
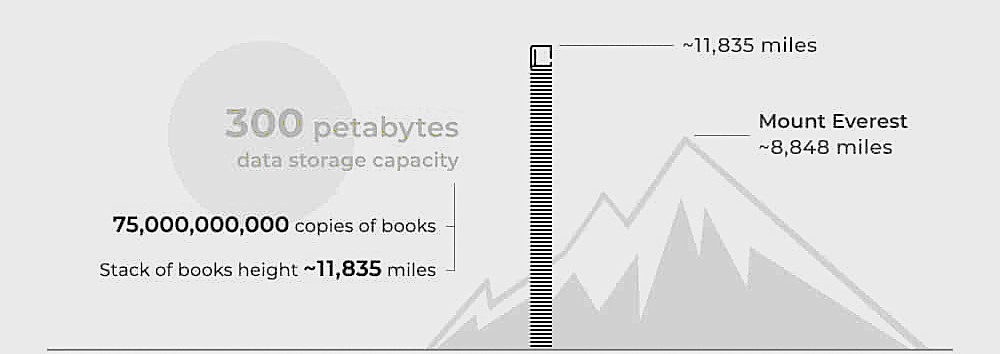
14. Users who register and engage with Facebook generate data that helps the platform gain insights into their preferences and interests. Every minute, Facebook users upload 2.46 million pieces of content, offering a continuous stream of information that the company uses to attract advertisers.
Facebook Ad Revenue
15. In 2022, Facebook’s annual revenue was approximately $116.6 billion, which marked a slight decrease from the $117.9 billion it earned in 2021. Although the difference is less than a billion dollars, this dip is significant as it represents Facebook’s first-ever decline in revenue in nearly 20 years of operation.
16. Experts believe that Facebook’s revenue decline is primarily due to reduced advertising demand, influenced by the growing popularity of TikTok and other emerging apps. By the fourth quarter, TikTok had amassed 1.6 billion users, capturing a significant social media market share.
Facebook’s Shift to Video-Centric Content
17. In response, Facebook has shifted towards more video-centric content, recognizing its appeal to advertisers. Video content has proven to be highly effective, with 93% of companies reporting that they gain new customers through this medium.
Short Reels Monetization
18. Inspired by TikTok’s success, Facebook has intensified its focus on promoting and monetizing Facebook Reels, its own short-form video feature. Short-form videos are particularly engaging, being 2.5 times more captivating than long-form videos. This is likely due to the shorter attention spans of modern consumers.
Facebook’s Data Tracking
19. Facebook’s extensive data tracking capabilities and its vast user base make it an invaluable resource for marketers. This effectiveness is reflected in the fact that 90% of marketers actively use Facebook advertising to expand their business awareness.
Video Ads CPC
20. Facebook video ads have the lowest cost-per-click (CPC) at $1.20, making them a cost-effective option compared to other ad formats. To illustrate the impact of this, imagine you’re selling a $15 product with a CPC of $4.15. Meanwhile, your competitor sells the same product at the same price but with a lower CPC of $1.20. Because of the lower advertising cost, your competitor can earn more profit per sale than you.
Facebook Ads CTR
21. Click-through rate (CTR) is a type of system calculated in percentage. Marketers use this metric to deduce how many clicks they get on their advertisements. Marketers calculate it by dividing the number of clicks by the number of impressions (the times the ad is shown) and then multiplying by 100.
22. For Facebook ads, the average CTR across all industries is 0.9%. This means that, on average, out of every 1,000 times an ad is displayed, it receives 9 clicks. This metric helps advertisers understand the effectiveness of their ads in engaging viewers.
Facebook User Interactions
23. On average, a Facebook user interacts with 12 advertisements each month. When breaking this down by gender, men tend to click on around ten ads monthly, while women engage with approximately 14.
Statistics on General Facebook Ad Revenue
Taking it a step further from its ad revenue, these pieces of general information about Facebook may surprise you. They typically reveal why the social media platform has become so big and popular globally, particularly in terms of its active users.
Facebook User Demographics
The biggest demographics of Facebook are the early Gen-Zers and millennials. The platform used to get more teen visits until other apps drew their attention. A good example is YouTube, whose users are mostly between the ages of 18 and 29. The same trend applies to Snapchat and TikTok.
24. In America, the most significant users of Facebook are over the ages of 12 to 34. While most of the US population, about 95%, are aware of Facebook, adult users are just two-thirds of this population.
25. Approximately 71% of America’s population engages with the social media platform for events, news, and updates.
26. As of April 2024, India has the highest number (378.05 million) of Facebook users, closely followed by the US, with 198.05 million. Indonesia ranks third in terms of Facebook usage, with over 119 million users.
Small Businesses and B2B Marketers
27. Facebook meets the requirements for B2B marketing, with 54% of marketers considering the platform as the best option for such transactions. Although LinkedIn holds the first place in terms of B2B marketing, Facebook’s huge user base keeps it trending for its ability to reach a broader audience.
28. Facebook offers much more than just a platform for advertising. Many people turn to social media, including Facebook, to look up services, businesses, restaurants, and other local offerings. Having an active and engaging Facebook page can significantly enhance a business’s credibility and online presence. In fact, Facebook is a popular choice among small businesses, with over 200 million of them maintaining pages on the platform.
Facebook Ad Revenue Projection
29. Projections indicate significant growth for Facebook, with an expected 9.7% increase in revenue by 2025, reaching $187.35 billion. Analysts also foresee that by 2026, the platform’s ad revenues will exceed $200 billion, fueled by an annual growth rate of 8.3%. This shows the height of the platform’s expanding influence and effectiveness in advertising.
30. According to the Sprout Social Index, Facebook is the leading platform for both consumers and marketers. In 2023, 71% of consumers and 65% of marketers plan to prioritize using Facebook over other social media platforms. Such a strong preference positions Facebook as the largest and most influential social media platform on the internet.
US and Canada Drive Ad Revenue
31. Users in the US and Canada significantly drive Facebook’s ad revenue growth. In the first quarter of this year, the average user in these regions spent $48.85 on ads, which is more than five times the global average of $9.62. European users contributed the second-highest amount, spending an average of $15.51 on ads. This highlights the substantial impact of North American users on Facebook’s ad revenue.
Ad Impressions
32. Impressions are a valuable metric for marketers, clearly showing how many people have seen their ads. This data is crucial for understanding the reach and effectiveness of ad delivery and viewing. By 2024, the number of ad impressions on Facebook will have increased by 30%.
Paid Ads and CPC/CPM
33. Paid advertising on Facebook can significantly boost ad sales quickly and offers precise audience targeting. Due to these advantages, approximately 24.2% of marketers are using paid ads to enhance their marketing efforts.
34. Facebook has no minimum monthly price for ads. As such, users are free to pay whatever they decide. This is quite beneficial to small businesses, as most of their monthly expenses on ads range between $200 and $1,500.
35. In the first three months of 2022, Facebook ads had a cost per click of $0.62. This figure was $0.10 lower in the same period of 2021.
36. Experts predicted that in April 2023, the value would be $0.94. But in the meantime, the highest cost per click for the platform stands at $0.97.
37. Marketers are expected to optimize their Facebook ads’ cost per thousand impressions (CPM) to the most favorable conversion rate. This will enable them to reach a broader portion of their target audiences. As of 2023, the platform’s CPM stood at $12.07. However, in January 2024, the value dropped to $5.67.
38. Facebook is the third most visited platform worldwide, coming behind Google and YouTube. While marketers on these two top platforms faced cost and competition challenges in recent years, they remain the platforms with the highest traffic globally.
39. The major contributors to the ad revenue Facebook makes are the US and Canada. Notably, about 77% of the total population in Canada is aware of the platform, making it the most recognized social media platform operating in the country.
40. 46.7% of the $135.94 billion ad revenue generated in 2022 came from North America alone.
Facebook Fun Facts
Facebook features several exciting facts that remain fascinating to its users. Let’s consider some of the most notable ones.
The Reason Behind Facebook’s Blue Color Choice
Facebook’s blue skin was not decided based on Artsy’s proclamation that blue is the world’s best color. The true reason hinges on Mark Zuckerberg’s red and green color blindness.
Friend as a Verb
The word “elbow” became a verb after Shakespeare introduced it. Facebook later introduced the act of using “friend” as a verb. Also, because of the platform, the words “unfriend” and “like” have become nouns.
AI Pacino’s Face and the Facebook Home Page
Before the notable 2007 redesign of Facebook, the platform featured a man’s face. However, it was impossible to identify who it was, as a binary code partly concealed the image. A book, The Facebook Effect, written by David Kirkpatrick, somehow revealed the image, and it turned out to be AI Pacino’s face.
Wrap Up
Social media has become a significant part of online marketing campaigns for businesses, with Facebook leading the pack due to its worldwide reach and vast user base. Many marketing specialists have adopted Facebook as their number one platform to connect, reach their target audience, and increase sales.
As a result of this trend, Facebook generates massive revenue from ads alone. Statistics show that ads contribute the largest share of Facebook revenue. These facts and statistics on Facebook ad revenue reflect the past and current positions of the platform. As the use of social networks for marketing increases, we can expect more expansion in Facebook ad revenue.
FAQs
According to Meta, in 2024, users will be able to unlink their Messenger, Facebook, and Instagram accounts. They will also have the leverage to unbundle their Facebook Gaming and Marketplace accounts.
To check your Facebook stats, log into your business page and go to Facebook Insights. You can also access these stats from your profile by clicking your profile picture and selecting the “See dashboard” button.
Facebook Reels, which came from Instagram, are very popular. Reels with audio have a 35% higher click-through rate than other video content. Overall, Reels on Facebook and Instagram get about 200 billion views daily.
Facebook is still growing, though more slowly. By the end of the fourth quarter of 2023, it had 3 billion monthly active users. In the US, people are spending around 31 minutes a day on Facebook.
As of January 2023, more men use Facebook (56.3%) than women (43.7%). The largest age group of Facebook users in the United States is 25 to 34-year-olds.